


Basic
Perfect for individual users
Free
- 5 chart analyses per day
- 5 chat messages per day
- Chart analysis
- Standard support
AI chart analysis, with on-chain, sentiment, CT and narratives in one read.
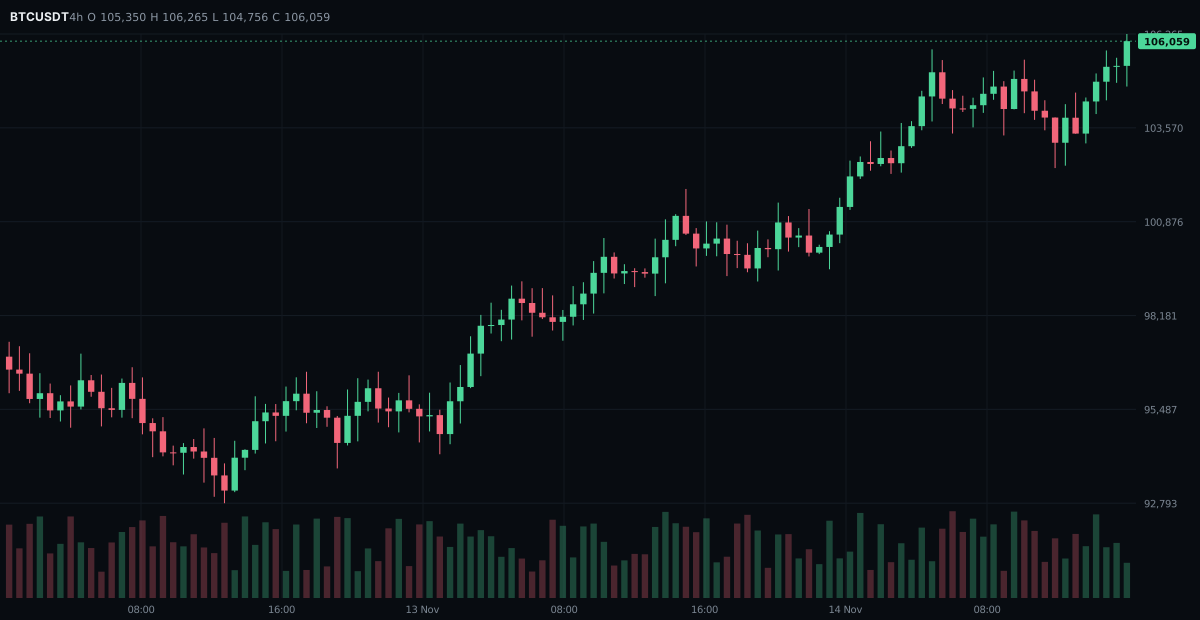
BTCUSDT 4h · Binance O H L C Live
 Sample data
Three steps, the same three the extension is built around.
Open a chart on TradingView and click the Wickly icon. Capture the full screen or drag over an area.
Captured Image
Review the captured chart before analysis
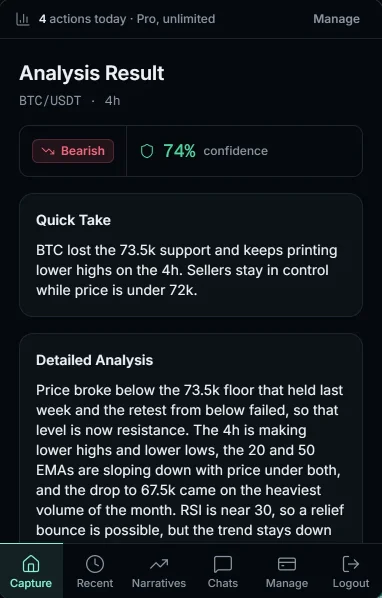
Get direction, confidence, a quick take and action items for that exact pair and timeframe.
Captured Image
Review the captured chart before analysis
Analysis Result
BTC/USDT · 4h
Quick Take
BTC lost the 73.5k support and keeps printing lower highs on the 4h. Sellers stay in control while price is under 72k.
Technical Confidence
Trend Strength
Strong
Volume
Confirmed
Support/Resistance
High
Market Structure
Trending
Ask follow-ups about the chart, attach images or files, and keep the thread.
Where's the next resistance on this chart?
09:41
I can see the image you attached. From the chart:
09:41
Simulations use sample data.
Bullish, bearish or neutral, with a confidence score coloured by band.
One-line read, the full reasoning, and numbered next steps.
Trend strength, volume, support and resistance, market structure.
Drop in screenshots, PDFs or notes and ask about them.
Your last 20 analyses, one tap to reopen.
Pro adds four data layers on top of every read. Your first analysis includes a free Pro preview.
Exchange netflow, whale transfers, active addresses and funding for the coin you analysed.
Social score for the coin and the market-wide Fear & Greed Index.
The latest posts from tracked CT accounts, each with a stance.
This quarter's strongest narratives by mindshare, and everything in one view.
Perfect for individual users
For active traders who need more
You capture a crypto chart and Wickly reads it: direction, confidence, a quick take, the reasoning, action items and technical confidence. Then you can chat about it.
All crypto. No stocks or forex.
On TradingView charts, through the Chrome extension. The demo runs the same popup on a sample chart page.
Each analysed capture and each chat message counts as one. Free gives you 5 a day, combined.
On-chain, Sentiment and CT Pulse on every analysis, plus Narratives and the Dashboard. Your first analysis on Free includes these blocks once, as a preview.
In the demo, all numbers are sample data generated in your browser.
No. Analyses are generated for illustration and are not financial advice.